


Hey there, it’s Jacob at Retention.Blog 👋
I got tired of reading high-level strategy articles, so I started writing actionable advice I would want to read.
Nearly every week I share practical learnings you can apply to your business.
Retention.Blog is sponsored by Botsi
Your A/B test is lying to you.
Move from A/B to AI with personalized offers for each user to increase LTV by 30-50%. Learn more →
Is your activation metric just a motivation detector?
This week is a guest post from Daphne Tideman, a growth product leader for wellness subscription apps. She scaled Heights from £28K to £343K MRR in 18 months and writes the Growth Waves newsletter.

I asked her to write the follow-up to my activation post, check out her newsletter for weekly teardowns and actionable app growth advice.

Hi there, my name’s Daphne 👋
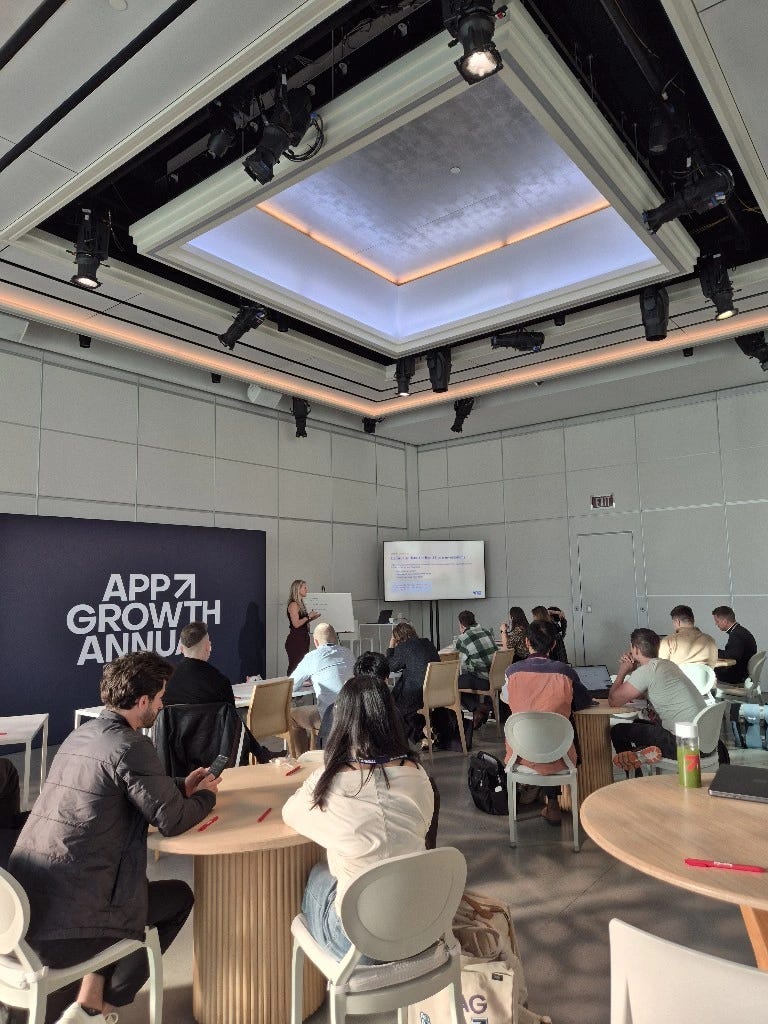
The other week I ran an activation workshop at RevenueCat’s App Growth Annual in New York.
It was the last session of the day, 4:40pm, when everyone is already mentally at drinks.
I opened by asking the room to write down their app’s activation metric in one sentence. The answers were good:
20+ minutes of listening
First workout completed
Two coaching sessions.
By the end of the hour, at least two people had changed theirs, and multiple attendees were in deep discussion about theirs. One of them updated his live, with his Mixpanel open on his laptop.
How to do that is the bit I want to share here.
Jacob already covered what activation is and how to brainstorm candidates in WTF is activation, so I won’t redo the definitions. This is what comes after you have a candidate:
Working out if it actually drives retention, or if it just spots the people who were always going to stay.
Here’s the five-step method I use with wellness subscription apps, plus the checks I run before I believe the number.
But first: Activity isn’t activation
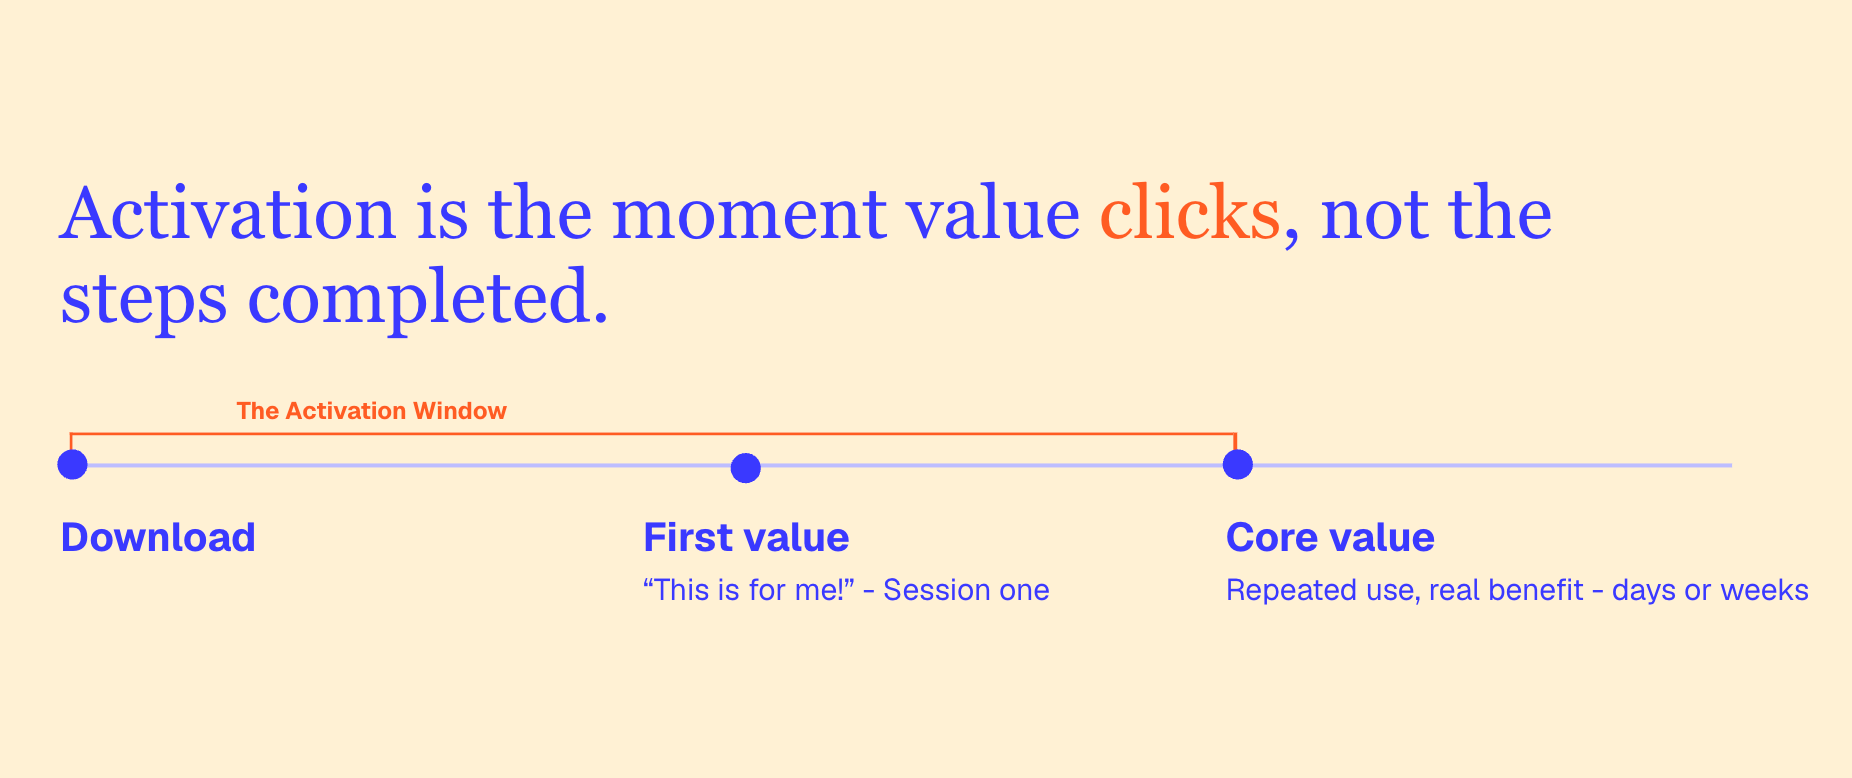
Activation is the moment value clicks, not the steps completed.
One app I audited had 90%+ onboarding completion on both iOS and Android. Most users still churned by day two.
Onboarding completion is an activity metric. People tapped through, but that doesn’t mean anything changed for them.
Onboarding is still a huge part of activation. It prepares the user and sets them up. But often your onboarding has to sell perceived value, because the real value takes longer.
For a running app, the real value is going on an actual run, which is a big ask in session one.
It’s okay to have two different moments, just don’t confuse them when you pick your metric.
A strong activation metric points at something downstream:
Duolingo: learners who reach a 7-day streak are 3.6x more likely to complete their course.
Ladder: users who complete at least 2 workouts during the trial are more likely to convert and retain.
Both are tied to long-term retention and, ideally, monetization. You work backward from there.
Step 1: Listen first
This is the step everyone likes to skip, partly because it’s the one you can’t hand to AI.
Before you open a dashboard, have at least five conversations. The more, the better.
Talk to recent, active subscribers, usually two to three months in.
I’m specific about this because of something that happened at one app. We interviewed loyal users who’d signed up two or three years earlier. Perfect on paper: high retention, high monetization.
But they’d joined during COVID, in a completely different period, with different expectations. Nothing they told us replicated for new users.
You’re listening for the job they hired the app for, in their words, not your feature list. I ask:
What did you try first?
What helped you understand the value?
What almost made you leave?
What people say isn’t always what they do. We see that way too often. But it’s a starting point that gives you a load of hypotheses to look at:
What users SAY tells you where to look. What they DO tells you if it’s real. You need both.
It helps you expand your horizons, so you don’t go straight down the rabbit hole of “our core value is obviously X.”
Step 2: Pull recent users, because old cohorts lie
Users from a year ago onboarded into a different product, from different channels, at different prices.
At one meditation app, the long-time customers only used it about once a month. Newer subscribers behaved nothing like that. If we’d built the metric around them, we’d have optimized for a habit new users didn’t have.
I cohort the last 13 to 17 weeks of signups. That gives you enough time to see D30 (and D90 for the older end), while being recent enough to reflect the app you ship today. With the speed most teams ship now, things will still change, but it’s a good balance.
You can also compare a couple of periods to see if a pattern holds. That can be really interesting too.
The most common analysis mistake I see? Averaging everyone since launch; if you do that you lose every nuance that matters.
Step 3: Compare behaviors (and check the volume)
Take 3 to 5 candidate behaviors from session one and week one. Split users into did vs didn’t for each. Compare D7, D30, and D90 retention.
You’re looking for the behavior that splits the curve, and the gap never closes.
Some behaviors split early, then converge. They gave people a short-term reason to open the app, not a reason to stay. You only see that if you look over a longer window.
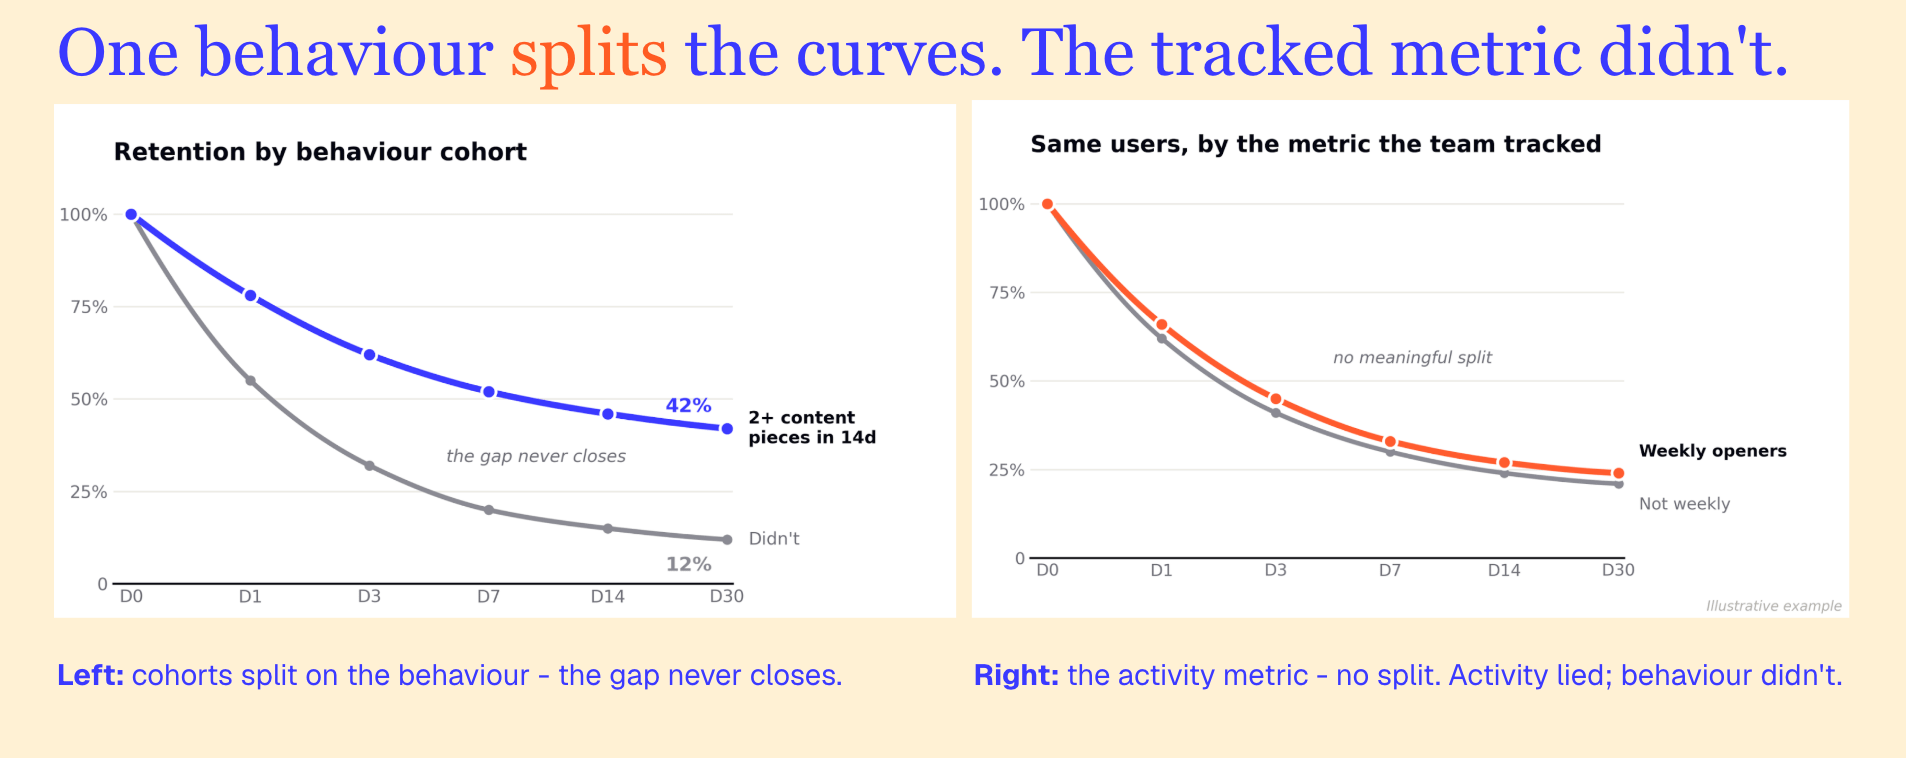
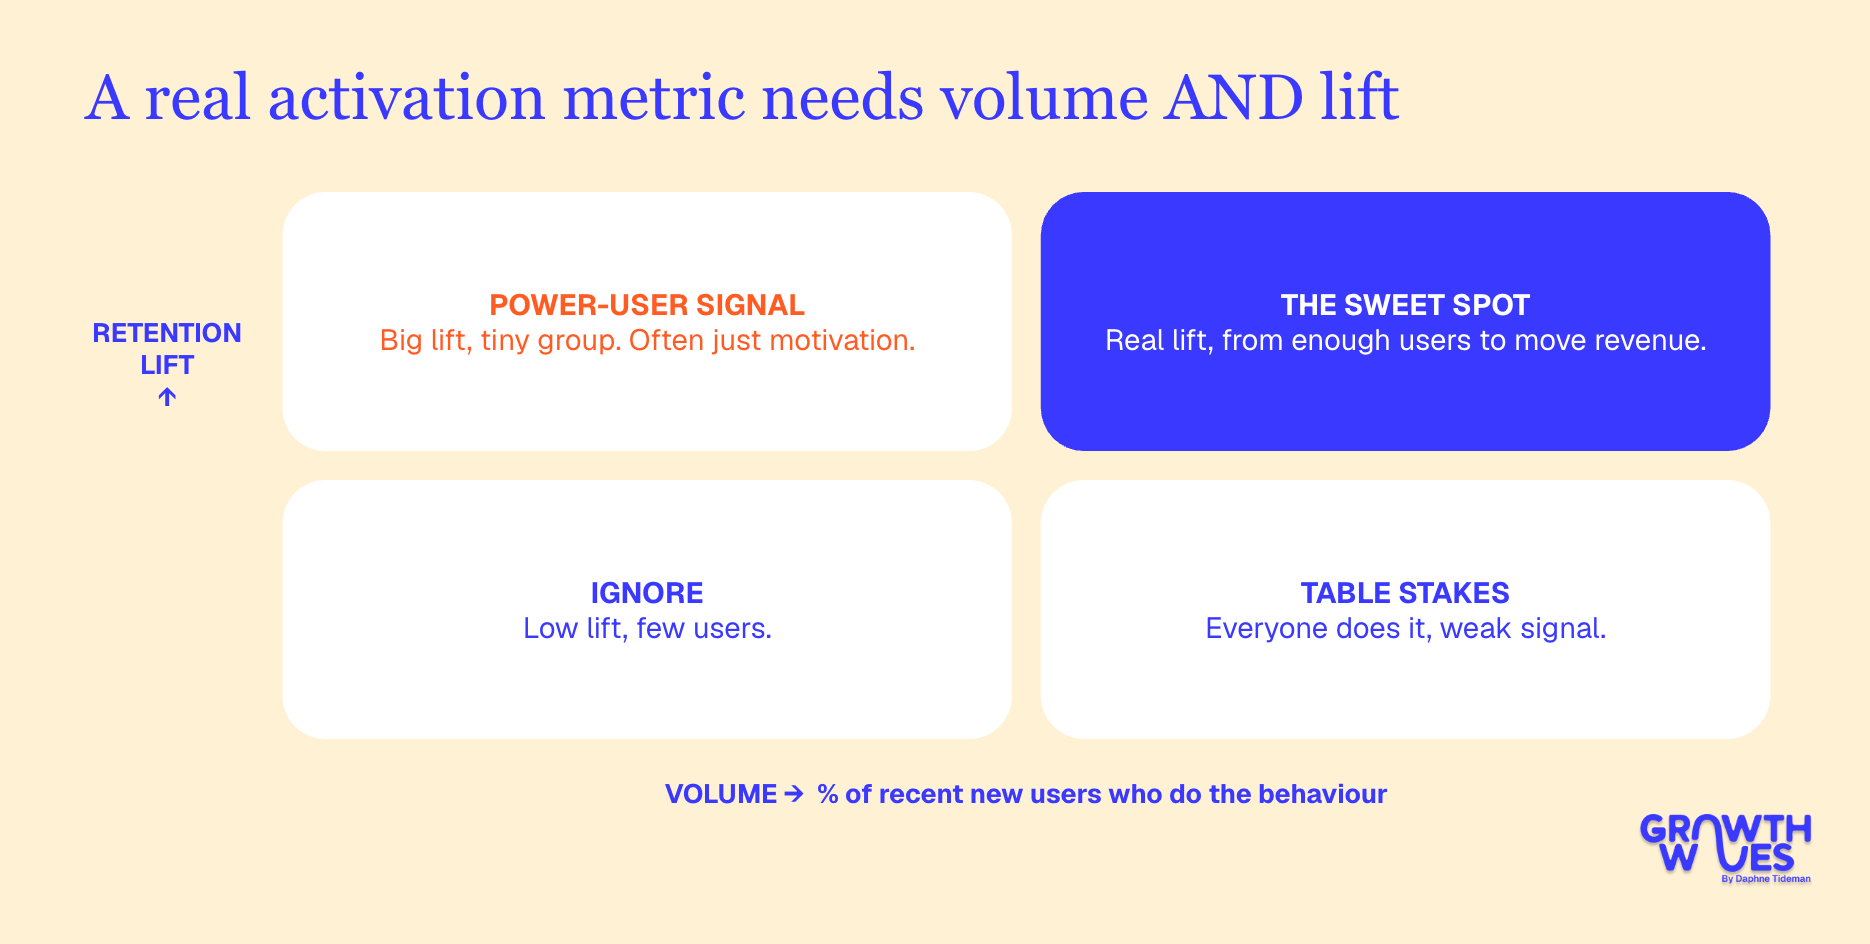
Most behaviors drive some lift. Not all lifts are equal. So you don’t pick the first behavior that shows a gap, you pick the biggest, most durable one, and then you double-check the volume.
We’d love it if everyone was running every day and super active, but the reality is the percentage of users who do that is very small. A real activation metric needs volume AND lift:
An example: I worked with an app helping Gen Zers fight loneliness by making friends. More friends was always better. Three beat one, five beat three, ten beat five.
But after a lot of user interviews, and looking at what share of users hit each number, we landed on five friends in a week. Because you don’t connect with someone after chatting once. You come back, you talk again, then you add them.
Five was the point where the lift was real and enough people could actually get there.
Step 4: Compare frequency
Your app’s ideal frequency might not be daily. The Duolingo comparison is the trap here, most apps are not daily-habit apps, and that’s okay.
At one wellness app I worked with, they released one bigger piece of content a week. The metric that predicted retention was 2 pieces of content in the first 14 days. That beat weekly opens, which was what the team had been tracking.
It sounds really oddly specific, but we checked all the different variations and that was the right frequency. Whether those two pieces landed in week one, or one in each week, didn’t matter much. Consuming more than one did.
Forcing users into a frequency that isn’t right for them is worse than having a less “engaging” app. If the value lives in the app, I’d aim for at least weekly to stay top of mind. But if they don’t need to be in your app to get value, don’t make them.
Also look at which days people do the thing. I recently analyzed a workout tracking app where Monday was by far the most popular day to log a workout, and weekends dropped off a cliff, even for people who signed up on a weekend.
That changes when you nudge, and what “on track” looks like in week one.
Step 5: Check timing
Sometimes it matters when users do the behavior. Doing it in week one might retain far better than doing it in week three.
But that isn’t the case for every app. So don’t add a time window for the sake of it. Check if it matters.
At one fitness app, four workouts was the sweet spot. It always outperformed zero, one, two, and three. But whether people got there by day 7, day 8, or day 15? The curves converged. It barely mattered.
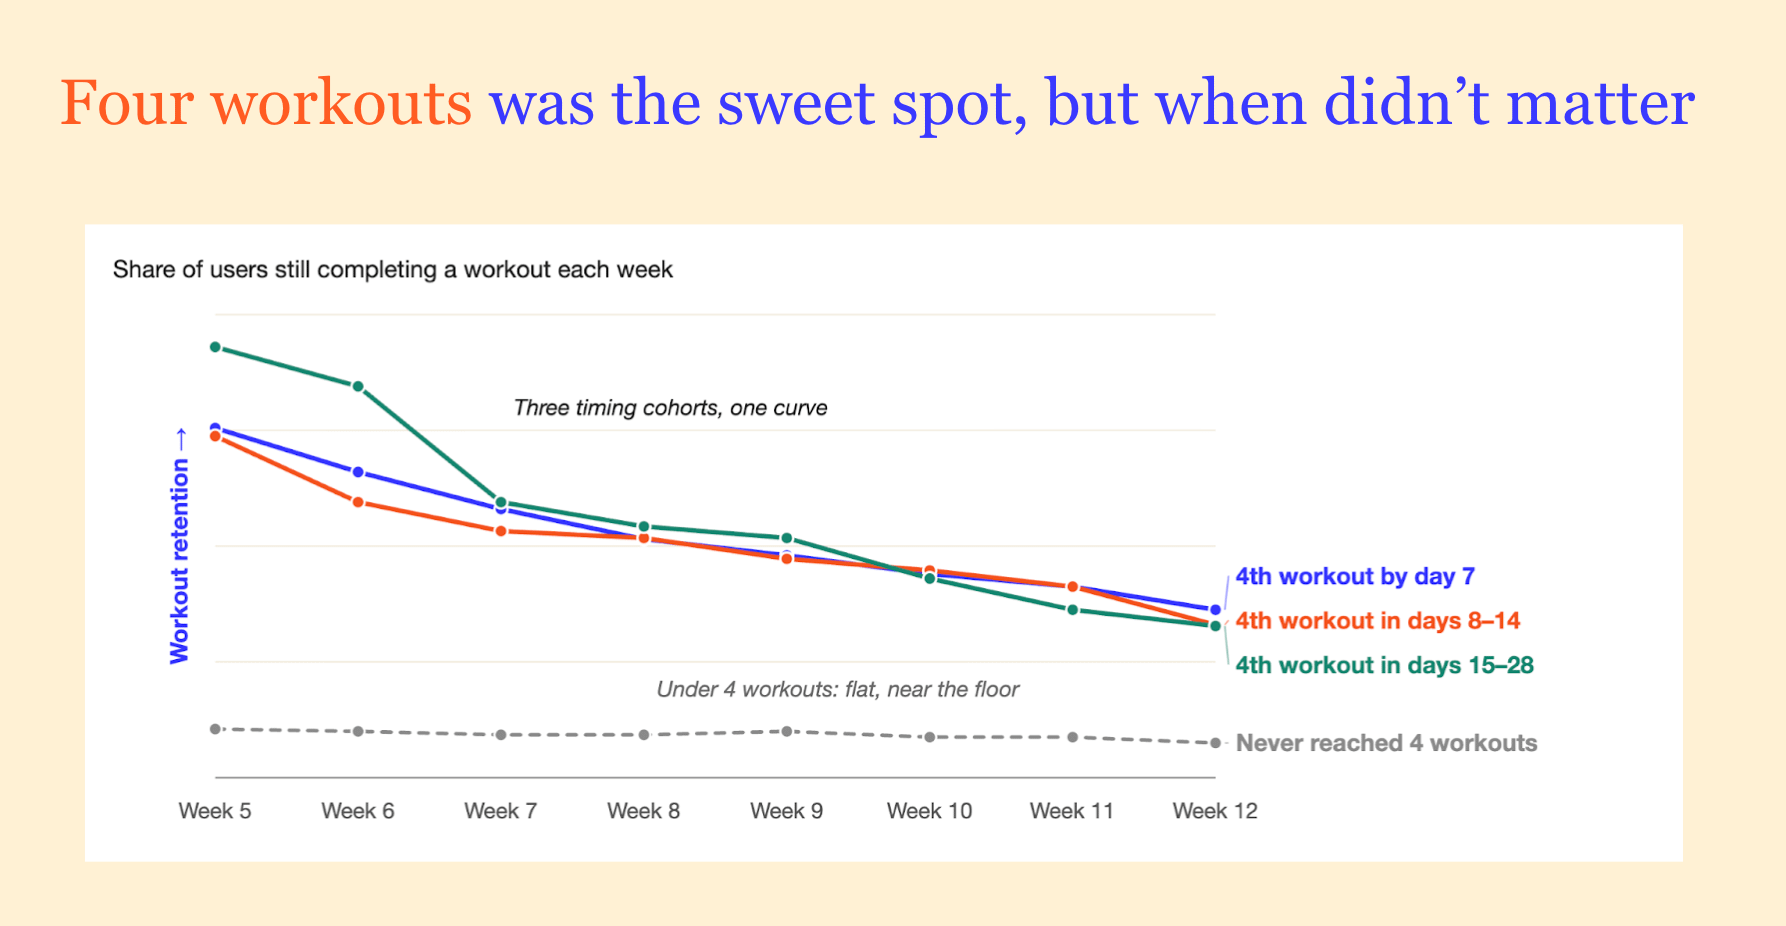
That changed our lifecycle messaging and timing of it. This audience was overwhelmed and had a lot going on in their lives.
Pressuring them to hit four workouts in week one would have backfired. What worked better was noticing when someone hadn’t worked out for two days and nudging them back, gently.
So, the five steps:
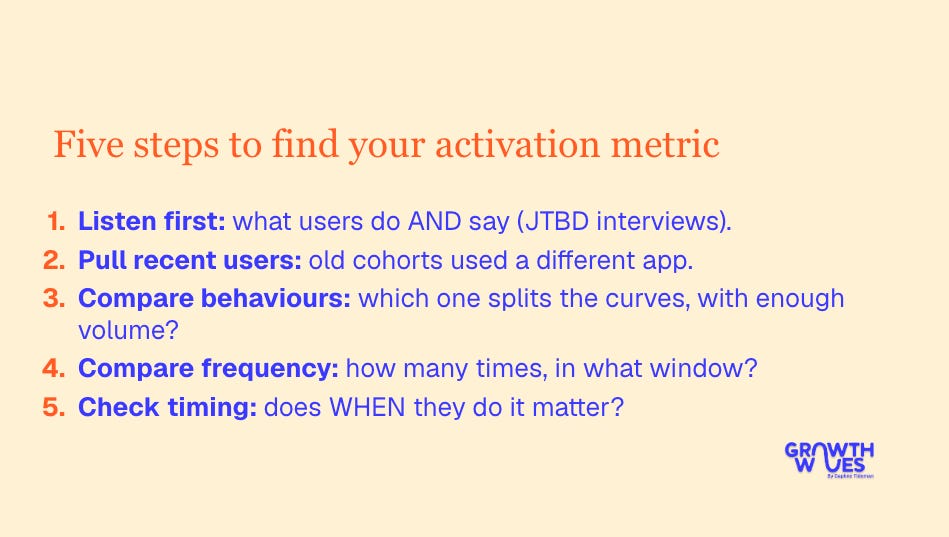
Listen first: what users do AND say.
Pull recent users: old cohorts used a different app.
Compare behaviors: which one splits the curves, with enough volume?
Compare frequency: how many times, in what window?
Check timing: does WHEN they do it matter?
This analysis takes an afternoon, not an analyst. The AI agents in Amplitude, Mixpanel, and PostHog make it easy now. A few people in the workshop had Claude running the analysis in the background while I talked.
Now assume it’s a motivation detector
Someone in the room asked a really good question: “How do I know this isn’t just survivorship bias?”
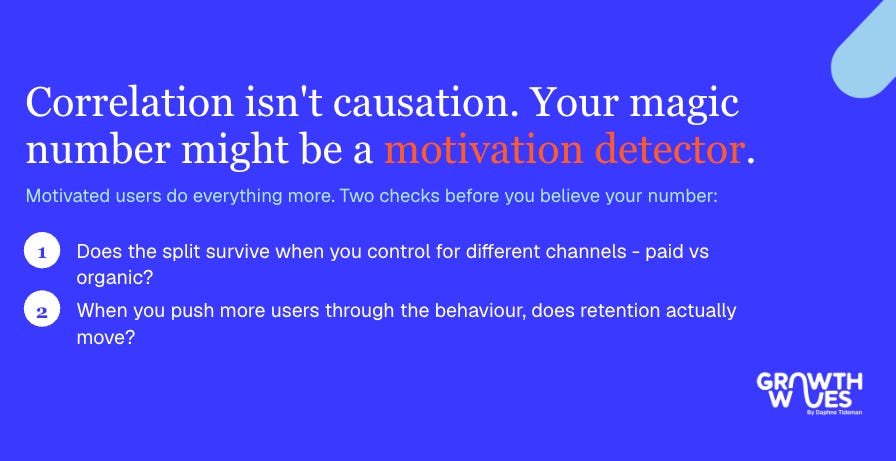
If we’re really honest, to some extent it always is. A user who does a behavior will almost always retain better than one who doesn’t. Motivated users do everything more. Your magic number might just be a motivation detector.
Here are the two checks to run first:
It also helps to test the opposite. Someone from Booking.com once mentioned in a talk that he spent six months testing every part of one block on a page. Nothing moved the needle. In complete frustration, he removed the whole block.
Intentionally stopping something can teach you as much as trying to improve it. (That story always makes me feel better.)
Same with lifecycle emails: we always kept a holdout group to see if users would have done it anyway.
And ask if your metric is gameable. If you made it so easy that everyone did it, or forced everyone through it, would anything move? We love removing friction, but sometimes that just means more people do the thing without understanding it, and you see no lift.
In the workshop, one founder came in with “completes 2 coaching sessions.” During the exercise, he changed it to “starts 1 session with personal context set, within 7 days,” because the coaching only feels like it knows you if you’ve given it that context.
I see it also more as steps along the journey rather than one activation metric: one thing that gets them to convert in the trial, another that gets them to the habit.
Finally, re-run it. Acquisition mix shifts, pricing changes, and product changes all move it. I glance quarterly and re-run properly once or twice a year. The behavior usually survives. It’s the threshold, the measurement, or the window that moves.
Then fix the drop-off: trust, context, or value
Once you trust your metric, you need to move it. In my experience, drop-off before activation is usually one of three problems:
👉 Trust: “I’m not giving you that yet.” Permissions, payment details, personal data, asked before any win.
👉 Context: “I don’t get what this is.” Or why it’s different. No tutorial fixes a positioning problem.
👉 Value: “I get it, I never felt it.” They understood the promise. The product never delivered the moment.
Here is a value example. Jacob already did the full Finch teardown in Life of a birb, so I’ll only add the activation lens. Self-care takes time before you feel it. Finch’s starter plan is mostly things you already do: get out of bed, brush your teeth, drink water.
In my test, four of the seven were things most people will have done already. I wasn’t testing it from bed, so I could check off a lot right away, get points, and Waffles my birb was very happy with me.
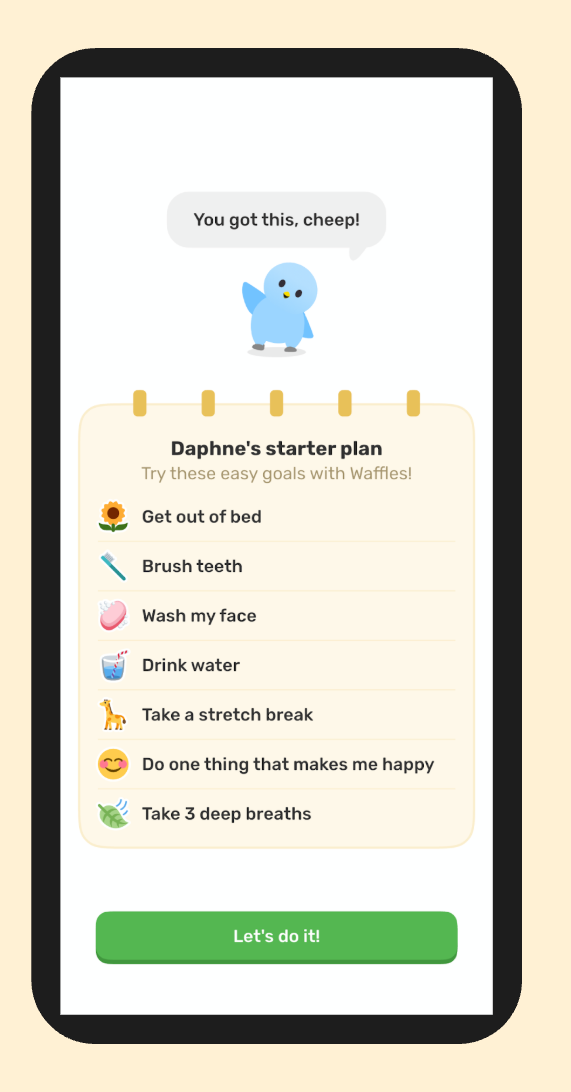
We often chase the aha moment, but it takes longer. Finch creates an “oh, I’m already doing this” win first, then adds one new thing.
So for your app: what’s the version of “a goal you’ve already achieved” in session one?
I think value is one of the hardest right now. Testing apps for the workshop, I kept asking myself: how is this actually different from AI?
You’re not only competing with apps in your space, but with ChatGPT too. So you need to deliver value and show how your way is different from everything they’ve tried before.
Your homework
Write your metric as a hypothesis:
A user who [specific action] [N times] within [timeframe] is significantly more likely to [retain past X / convert] because [the value they’ve now felt].
Leave out the timeframe if step 5 says it doesn’t matter. Then write down your biggest doubt about it.
Then two things:
The analysis: “I will pull [this cohort comparison] to check whether [my action] separates retained users from churned ones.”
The test after that: “If it holds, the first activation change I’ll test is…” Pick one of trust, context, or value.
It’s okay if the analysis kills your metric and you go back to the drawing board.
After the workshop, one of the keynote speakers came up and said they were as much in the dark as anyone about what’s really happening.
I think that’s the reality when you talk to any app team. We’re all muddling along trying to work it out. None of us have it fully figured out.
That’s why taking the time to really challenge your metric is always worth it.
Daphne Tideman writes Growth Waves, weekly teardowns and growth advice for subscription apps at growthwaves.io.
She works with wellness and impact apps on activation, retention, and monetization.
You may already be subscribed because she’s part of my recommendations for the newsletter, but if you’re not, she writes super valuable content. A great read :)
📣 Want to help support and spread the word?
Go to my LinkedIn here and like, comment, or share my posts.
OR
