

How to run a good experiment
Think like a scientist

Hey there, it’s Jacob at Retention.Blog 👋
I got tired of reading high-level strategy articles, so I started writing actionable advice I would want to read.
Every week I share practical learnings you can apply to your business.
A/B is easy to do, but hard to get right
When done properly, it’s one of the only ways to truly measure the incremental impact of your efforts.
Growth has its roots in the scientific method, and when we’re running A/B tests, we need to think like a research scientist.
We’re trying to prove that our work actually has caused an impact!
It turns out, proving your marketing did absolutely anything at all is pretty hard sometimes.
So where do we start?
Easy, we just:
Create a data-backed hypothesis
Calculate sample sizes
Figure out your baseline conversion rate
Based on those sample sizes, figure out how long you need to run your experiment for
Design your experiment so you’re isolating variables and testing one thing at a time
Ensure your audiences are randomized and not biased
Verify that users are receiving the same variant if they can see it multiple times
Check that there aren’t other experiments currently running in the same area that may muddy your results
Decide on success criteria in advance so there isn’t a debate whether the test was successful or not
Check that you’re recording the necessary events to measure the success criteria
Actually launch the test
Don’t pause your experiment once you reach stat sig, and let it run the full experiment length
Once the test is finished running, don’t forget to check the results and scale the winning variant.
What separates top growth teams from the rest?
Doing this process 100-1000 times a year.
How do you form a hypothesis?
Start with your goals - what are you trying to impact?
What is the problem you want to fix?
What are you going to change?
Why do you think your idea or solution is the right one?
What have you tried in the past?
What do you see competitors or others in your industry doing?
For example:
Goal: We want to increase the percentage of people starting a trial
Problem: People don’t understand the value our product offers
Change: Update copy on the paywall
Rationale: We surveyed our users who subscribed, and they said they value this particular feature, but we don’t talk about that on our paywall
Hypothesis: New users don’t understand the value of our product and are interested in feature X. By adding a copy to our new user paywall calling out this feature, we’ll increase trial start rates.
Notes: The hypothesis doesn’t contain the estimated lift or projection.
What should you test?
Ideas are easy, right? Good ideas aren’t quite as easy…
Test ideas and concepts that are meaningfully different.
There is a time and place for small optimizations, but until you have a solid understanding of your user base and what works and what doesn’t, you want each variant to be a significant change.
The worst possible result is not your experiment failing, the worst outcome is that the test is inconclusive and you didn’t learn anything.
Not learning and wasting time is much more likely with small changes
Our goal is always learning. Whoever can learn the fastest wins.
Of course, don’t test stupid ideas because it’s a big change.
Test two different things that both have a strong chance of succeeding.
The tricky part comes when you remember you should isolate variables and only change one thing at a time.
This doesn’t mean you can only change one word in a sentence of an email but try to only test copy or only test a new image. Or for a push notification don’t change the copy and timing of when it’s sent, only change the timing.
Where do the best ideas come from?
User research, talking to customers, using your product, real quantitative analysis, things that work well for competitors or industry leaders
Now you have an idea - how do you set up the experiment?
First, figure out how many people are going to see the experiment.
You should already have this data to decide whether you launch this experiment or not, but I’ll cut you some slack this time.
Do you have historical conversion rates for this campaign or a similar campaign?
If not, that’s okay. Make an informed estimate
Do you have historical data or an estimate of the potential lift this campaign could generate?
It’s better to be conservative here. We always think our ideas are better than they are
But also, you want your lift to be impactful.
Stick to a 50-50% A/B test whenever possible (or A/control)
I know you have 3 great ideas of possible variants and you want to test them all. Don’t do it.
You have a larger risk of an inconclusive test because you need a much larger sample size and conversion difference between the variants
Test fewer variants to learn faster (I know, it’s counterintuitive)
Now let’s take all of those inputs to figure out how long we need to run our test:
Daily, weekly, or monthly traffic or event exposure
Historical conversion rates
Estimate of lift from the test
Number of variants
I like CXL’s A/B test calculator for a quick pre-test check:
Let’s say 20k people a week will see the test:

And 5% of our users currently convert (this could be purchases, registrations, feature usage, etc.):

We’ll keep it at 2 variants - 1 new variant and 1 control group
95% confidence is the standard and so is 80% power. I’d stick with these for now.
Depending on the test and type of product, you could decide to lower your confidence level to 90% but going much lower greatly increases the risk of false positives
If you do decide to use a 90% confidence interval, you need to decide that before you run your test. Don’t change things around after to give yourself a positive result
Go back and grab your estimated conversion lift from this new test
We can use this as our MDE to figure out how long we need to run the test for
Let’s say we thought this would generate a 6-7% lift based on historical tests
Based on that conversion rate, we should plan to run this test for 4-5 weeks.
Note: I realize the estimated conversion lift is not the MDE definition, but it’s likely OK to use that when getting started. Read this Optimizely article on the MDE to dive into all the nuances.
Play around with the different values to understand how they change the time and MDE needed.

Going back to my point about multi-variate tests, let’s add one more variant and see how that changes the MDE and time needed:

We can see that the lift needed can be 50%+ higher and could easily cause us to need to run the test for twice as long.
Time = money. Test less to learn faster.
Calculating stat sig and doing the pre-test calculations to figure out how long you need to run your test and the lift needed is one of the most important steps. Skipping it will come back to bite you in the long run.
What else?
Make sure your audiences for each variant are randomized.
Most A/B test tools now are pretty good at this automatically, and if your audiences are sufficiently large, this shouldn’t be a major issue
If for some reason, you’re manually choosing test groups, pick a few key data points and check the distribution across both groups:
Are roughly the same number of users male and female?
Is the age distribution roughly the same?
Are roughly the same number opted-in to push notifications in each group?
Verify that users are receiving the same variant if they can be exposed multiple times
Will user_ID: 1853295 always see variant A when they open the app?
This is usually a larger issue for in-product tests. When someone is opening your app, are they always going to be exposed to the same experience? If not, you have a major experiment flaw.
A lot of times this is a simple check-box in your A/B test tool. For example, in Amplitude, it’s called “Sticky Bucketing.”
Note: This gets much harder when you’re controlling experiences through multiple tools. What if you’re running a sale campaign and you have an in-app message controlled through one tool, but you’re also pairing emails and push notifications with that sale campaign? Making sure the variants are consistent across tools can be quite a large pain and isn’t a simple task.
Check that there aren’t other experiments running in the same area that may invalidate your results
Do you have multiple experiments running during onboarding and you want to launch another? Think carefully, because you may need to wait
The chance of biased data greatly increases with more overlapping experiments, even when you’re randomizing experiment assignments
2 overlapping experiments with 50-50 splits, turn into 4 variants with 25-25-25-25% split
3 overlapping experiments with 50-50 splits turn into 9 variants with 11% in each variant. Unless you have 10-100 million users in your app, it’s very easy for an audience of this size to be skewed somehow.
Randomness doesn’t mean perfectly even distributions
Don’t pause your experiment once you reach stat sig. Let it run the full pre-decided length of time
I know you want to check your experiment every day and check whether it’s stat sig or not, but this can cause you to stop your test at a random time.
Test results can oscillate back and forth from stat sig or not day by day.
When you look at the actual data for a test, it often resembles something like the graph below. The two variants can cross over, and if you pick a random time to stop the test, you can see how you may be misled by whatever variant happened to be winning at that time.
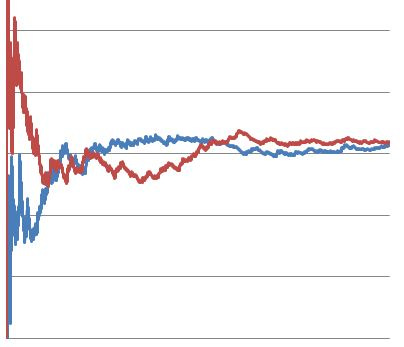
Image credit to https://www.confidenceinterval.com/blog/making-sense-of-ab-testing-statistics/
Another note: The important part is not that you can’t look at your test, it’s that you can’t stop it. I’ve seen lots of advice that says, “Don’t look at the results until it’s done!”
From the history of the first A/B test, I don’t believe this has ever been done. Nobody can resist. You have to peek. So again, just don’t stop it early!
Decide on success criteria in advance so there isn’t debate on whether the test was successful or not
You need to know what success means in advance. Otherwise, it’s easy to trick yourself into thinking the test was successful
We all want our tests to do well, so we can cherry-pick analysis or data that shows a result to be positive
If we look hard enough, we can probably find a metric that looks good
When you decide on success in advance, this stops unhelpful debate and “biased” analysis
Check that you’re recording the necessary events to measure the success criteria
Many times, I thought I could measure something and I had the data available, only to run the experiment and realize I was wrong. The data I was counting on for success couldn’t be tracked. Fail.
Double and triple check that you have the right data being tracked to accurately analyze the results
And if you’re not familiar with your A/B testing set up, make sure that you have the conversion values setup to actually record that data.
Waaay too often do people assume because the event exists, we can go back and analyze success after the test. More often than not, that event has to be “mapped” in advance.
We all want to move fast, but being careful and methodical is faster in the end because it means you’re not doing redoing work when you botch a test!
Now actually launch the test!
If you don’t set it live it’s all for nothing
Don’t get too scared by all the necessary pre-work.
The only way to get better at the process is to do it, make mistakes, do it again, and make fewer mistakes
And once the test is finished running, don’t forget to check the results promptly and scale the winning variant.
We all have so much going on so it’s easy to wait longer than we need to analyze the results
The longer you wait to analyze, the more potential gains you’re losing
Set reminders and block time on your calendar when the test should be done for analysis
After analysis, make the decision quickly and scale it if it is successful
Experimentation is a game of speed and compounding gains, don’t lose out on gains by letting winning tests sit idle
Want more on A/B testing?
Go check Olga Berezovsky’s Data Analysis Journal and click the A/B testing tab here.
When I remember, I also try to share highlights from LinkedIn:
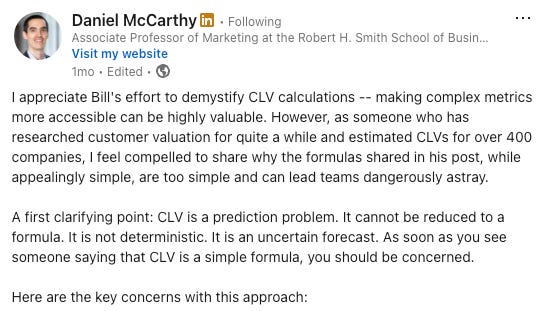
While we’re in data analysis world, go read this LinkedIn post from Daniel McCarty on why customer lifetime value is hard (he is a really good follow):
📣 Want to help support and spread the word?
Go to my LinkedIn here and like, comment, or share my post.
OR
Share this newsletter by clicking here.
